
Station 11 — Interpretation of Demographic Indicators
🎯 Candidate Task
A demographic chart, index or numerical indicator is provided at the station. Identify the indicator, interpret the information shown and state its demographic significance.
⚡ Model Station Answer
“`
Population pyramid: I would assess the age-sex distribution and determine whether the population pattern is expansive, stationary or constrictive.
HDI: This is a composite measure based on health, education and standard of living; a higher value indicates greater human development.
PQLI: It combines infant mortality, life expectancy at age one and literacy; a higher score indicates better physical quality of life.
Growth and dependency: A positive growth rate indicates population increase, while a high dependency ratio means more dependent people relative to the working-age population.
🔎 How to Perform / Approach
- Step 1 — Identify: Decide whether the material shows a population pyramid, HDI, PQLI, population growth rate or dependency ratio.
- Step 2 — Read systematically: Check the title, axes, units, age groups, sex distribution or numerical value provided.
- Step 3 — Describe the pattern: State the dominant feature without immediately jumping to a conclusion.
- Step 4 — Apply the correct meaning: Relate the observed value or shape to the relevant demographic concept.
- Step 5 — Interpret direction: Decide whether the indicator suggests population expansion, stability, decline, better development or greater dependency.
- Step 6 — State significance: Give one concise implication for population structure, development or service needs.
Rapid Interpretation Guide
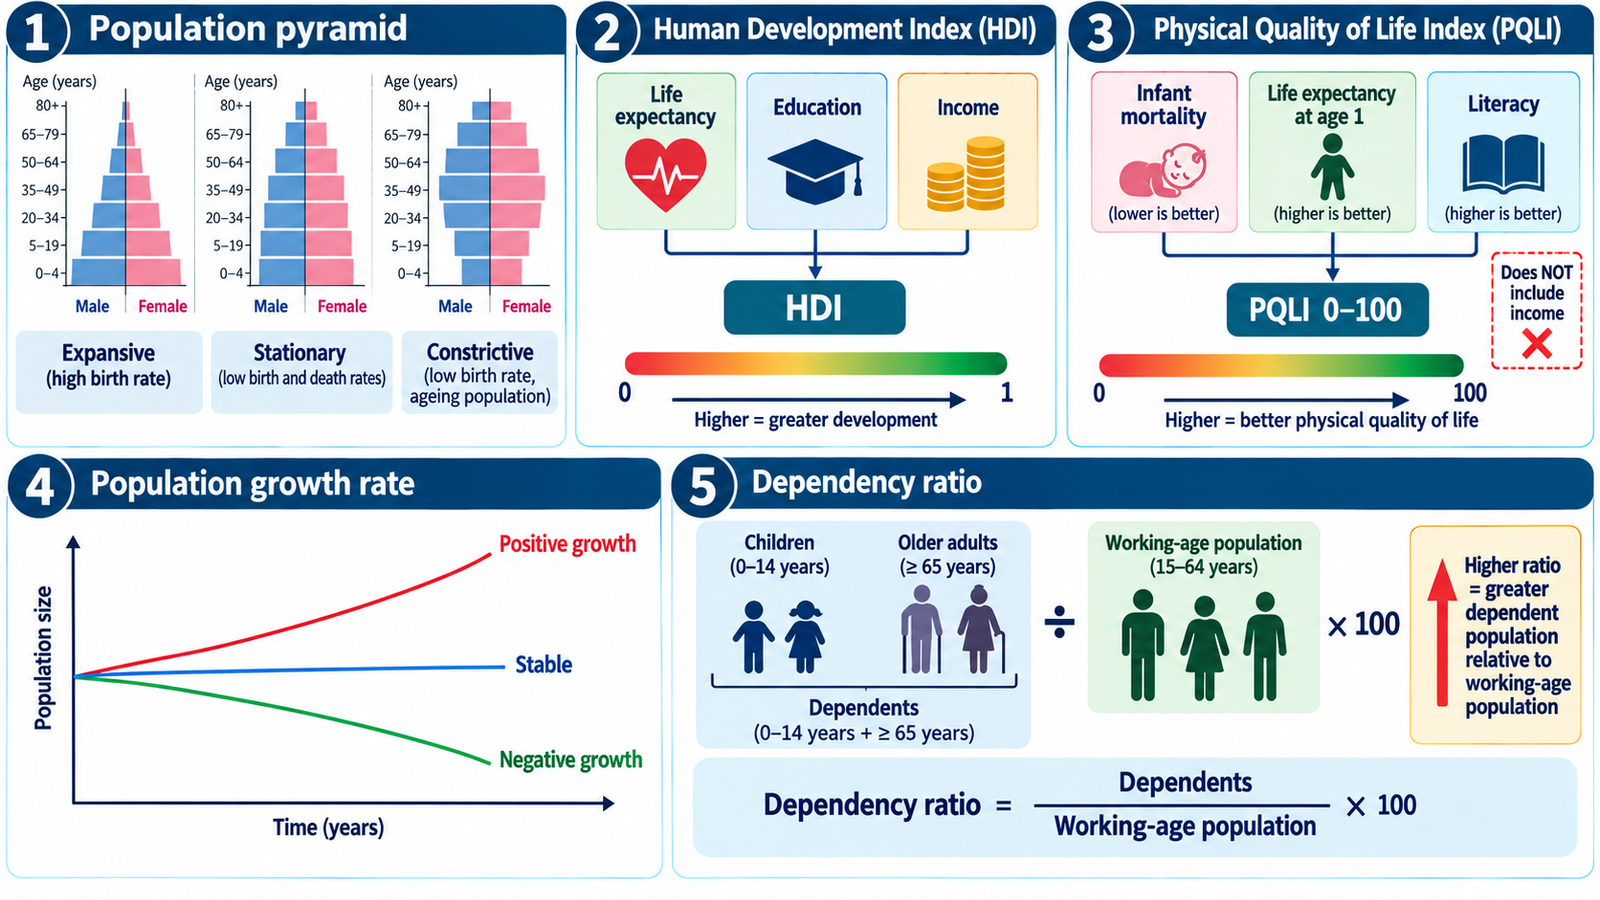
Population pyramid: Broad base = many children and usually a growing population; roughly similar width through many age groups = more stationary pattern; narrow base with proportionally more older adults = constrictive or ageing pattern.
Human Development Index (HDI): Composite indicator incorporating life expectancy, education and income. Values closer to 1 indicate higher human development.
Physical Quality of Life Index (PQLI): Based on infant mortality, life expectancy at age one and literacy. It is expressed on a scale from 0 to 100; higher values indicate better quality of life.
Population growth rate: Shows how rapidly a population is increasing or decreasing over a specified period. Positive growth means population increase; negative growth means population decline.
Dependency ratio: Compares the dependent age groups with the working-age population.
Formula: Dependency ratio = [(population aged 0–14 + population aged 65 years and above) ÷ population aged 15–64] × 100.
🖼️ Visual Learning
Rapid Interpretation of Major Demographic Indicators
📝 Important Viva Questions
1. What does a broad-based population pyramid usually indicate?
Answer: It indicates a large proportion of children and usually suggests a growing population with relatively high birth rates.
2. What three dimensions are included in the Human Development Index?
Answer: HDI incorporates health, education and standard of living, represented by life expectancy, educational measures and income.
3. Which three indicators are included in PQLI?
Answer: PQLI uses infant mortality, life expectancy at age one and literacy.
4. What does a negative population growth rate mean?
Answer: It means the total population is decreasing over the specified period.
5. How is the dependency ratio calculated?
Answer: It is calculated as the population aged 0–14 plus 65 years and above, divided by the population aged 15–64 years, multiplied by 100.