
Course Content
🔬 Station 1 — Identification of Lipoma
Learning Outcomes Identify a lipoma from a provided gross specimen/image or histopathology slide. Identify the key morphological features supporting the diagnosis. Differentiate the lesion from an obviously malignant soft-tissue lesion when asked.
0/1
🔬 Station 2 — Identification of Squamous Cell Carcinoma
Learning Outcomes Identify squamous cell carcinoma from a provided gross/microscopic specimen. Recognize the important morphological features of squamous differentiation. State the diagnosis from the findings provided.
0/1
🔬 Station 3 — Fibroadenoma of Breast: Gross & Microscopic Identification
Learning Outcomes Identify fibroadenoma from a gross specimen or histological image. Recognize the important gross and microscopic points of identification. Give the final pathological identification.
0/1
🧬 Station 4 — Karyogram Preparation & Chromosomal Abnormality Identification
Learning Outcomes Arrange chromosomes appropriately to prepare a karyogram. Determine chromosomal sex from the karyogram. Identify a common numerical chromosomal abnormality from a provided karyogram.
0/1
⚗️ Station 5 — Tissue Organ Bath: Identification, Setup & Tyrode Solution
Learning Outcomes Identify the major components of a tissue organ bath. State the function of the important components. Identify the constituents/purpose of Tyrode's solution. Demonstrate the basic placement/fixation of isolated ileal tissue in the organ bath.
0/1
📈 Station 6 — Acetylcholine Dose–Response & Ceiling Effect
Learning Outcomes Demonstrate the effect of increasing doses of acetylcholine on isolated rabbit ileum. Recognize the ceiling effect. Interpret a provided tracing/dose-response recording. Plot or interpret the corresponding dose-response graph.
0/1
📉 Station 7 — Competitive Antagonism on Isolated Rabbit Ileum
Learning Outcomes Demonstrate/recognize surmountable antagonism using an agonist and antagonist. Interpret the experimental tracing. Explain the change in response after addition of the antagonist. Identify the pharmacological relationship demonstrated.
0/1
👁️ Station 8 — Rabbit Eye Pharmacology: Identify the Unknown Drug
Learning Outcomes Assess/interpret pupil size, conjunctival appearance, corneal reflex and light reflex. Compare the test eye with the control eye. Interpret the pattern produced by an autonomic or local anaesthetic drug. Identify the most likely unknown drug from the observed findings.
0/1
📝 Station 9 — Medico-Legal Autopsy Report
Learning Outcomes Review supplied postmortem findings systematically. Complete the important components of an autopsy report. Formulate an appropriate final opinion from the supplied findings.
0/1
🧪 Station 10 — Toxicology Sample Collection & Preservation
Learning Outcomes Select the appropriate viscera/specimens required for toxicological examination. Select the appropriate preservative/container. Demonstrate or describe correct collection, labelling and handling of the sample. State essential precautions before dispatch.
0/1
⚰️ Station 11 — Identification of Postmortem Changes
Learning Outcomes Identify the postmortem change demonstrated on a model/image/specimen. Describe its characteristic features. Differentiate commonly confused postmortem changes where appropriate. State its basic medico-legal significance, particularly in relation to time since death.
0/1
🚑 Station 12 — Gastric Lavage / Stomach Wash on Manikin
Learning Outcomes Prepare the equipment required for gastric lavage. Demonstrate the correct sequence of gastric lavage on a manikin. Maintain patient safety and correct positioning during the procedure. Recognize situations in which the procedure should not be attempted.
0/1
🧪🔬 AIM OSPE/OSCE Lab — Multisystem-I Module | 3rd Year MBBS
AIM OSCE / OSPE • MBBS

Station 6 — Acetylcholine Dose–Response & Ceiling Effect

Rapid Revision • Practical Skills • Viva

🎯 Task

CANDIDATE TASK

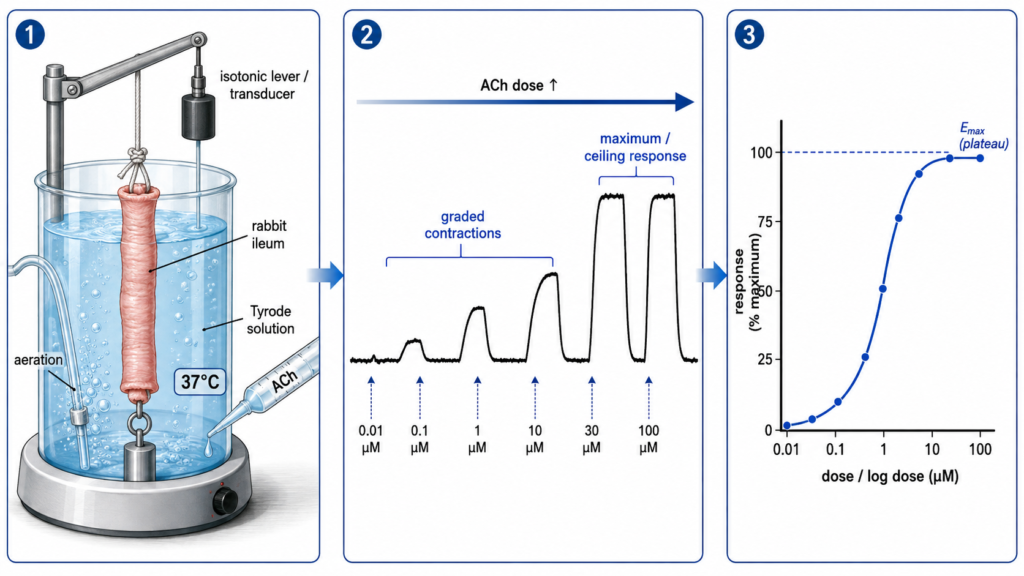
You are provided with an isolated rabbit ileum preparation and a tracing obtained after administration of increasing doses of acetylcholine. Describe the correct experimental approach, interpret the recorded responses and construct or interpret the corresponding dose–response graph.

⚡ Model Station Answer

What to say in the exam

Technique: I would record contractions of the isolated rabbit ileum after progressively increasing doses of acetylcholine under constant experimental conditions. Response: Increasing doses produce progressively greater contractions until a maximum response is reached. Ceiling effect: A further increase in dose produces no appreciable increase in contraction; this plateau represents the ceiling or maximal effect. Graph: Dose or log dose is plotted on the X-axis and response, usually percentage of maximum response, on the Y-axis. The log dose–response curve is typically sigmoid.

🔎 Stepwise Procedure / Approach

  1. Mount the isolated rabbit ileum in an organ bath containing Tyrode solution and maintain appropriate aeration and physiological temperature.
  2. Connect the tissue to the recording system and allow it to equilibrate until a stable baseline is obtained.
  3. Administer an initial low dose of acetylcholine and record the height of the contraction.
  4. Wash the tissue appropriately and allow it to return to baseline before the next response when using a non-cumulative recording method.
  5. Give progressively increasing doses of acetylcholine while keeping the experimental conditions and recording cycle constant.
  6. Observe the graded increase in contraction and record the response produced by each dose.
  7. Continue until increasing the dose produces no further meaningful increase in contraction. Confirm the plateau with a subsequent higher dose.
  8. Measure the recorded responses and take the maximum response as 100% when percentage response is required.
  9. Plot dose or log dose on the X-axis against response or percentage response on the Y-axis and identify the maximal plateau.
Exam point: The ceiling effect is identified when a higher dose fails to produce a greater response despite otherwise adequate experimental conditions.

🖼️ Visual Learning

VISUAL 1

Rabbit Ileum Experiment, Tracing & Dose–Response Curve
🎥 Practical Video

🎥 Practical Demonstration
Rabbit Ileum — Effect of Acetylcholine
Source: Dr. Shagufta Zaman

Watch the practical demonstration of acetylcholine acting on isolated rabbit ileum. Focus on the experimental setup, addition of acetylcholine and the resulting ileal contraction relevant to interpreting the dose–response experiment.

▶ Watch Practical Video “`

📝 Important Viva Questions

Q1. What effect does acetylcholine produce on isolated rabbit ileum?

It produces contraction of intestinal smooth muscle, predominantly through activation of muscarinic receptors.

Q2. What is meant by a graded dose–response?

The magnitude of response increases progressively as the dose or concentration of the agonist is increased, until the maximum response is reached.

Q3. What is the ceiling effect?

It is the maximum response of the tissue beyond which increasing the agonist dose produces no further meaningful increase in effect.

Q4. How would you recognize the ceiling effect on the experimental tracing?

Successive higher doses produce contractions of essentially the same maximum height rather than progressively larger responses.

Q5. What is plotted on a dose–response graph?

Dose or log dose is plotted on the X-axis, while the measured response or percentage of maximum response is plotted on the Y-axis.

Q6. What is the usual shape of a log dose–response curve?

It is typically sigmoid or S-shaped, with a lower portion, a relatively steep middle portion and an upper plateau.

Q7. Why is the tissue washed between doses in a non-cumulative experiment?

Washing removes the previous drug from the organ bath and allows the tissue to recover toward baseline before the next dose is tested.

Scroll to Top
💬 WhatsApp Support