🩺 Station 18 — Systematic Analysis of ECG
AIM OSPE/OSCE Lab — Practical Station | KMU Style | MBBS Practical + Viva
📌 Station Overview
Module: Cardiovascular System
Year: 1st Year MBBS
Focus: Identification • Procedure • Interpretation • Viva
Total Marks: 5
📋 Complete OSPE Station Content
Learning Target
By the end of this station, the student should be able to:
- Analyze a basic ECG systematically using a simple stepwise method.
- Identify normal ECG components including P wave, PR interval, QRS complex, ST segment, T wave, rhythm, rate, axis, and calibration.
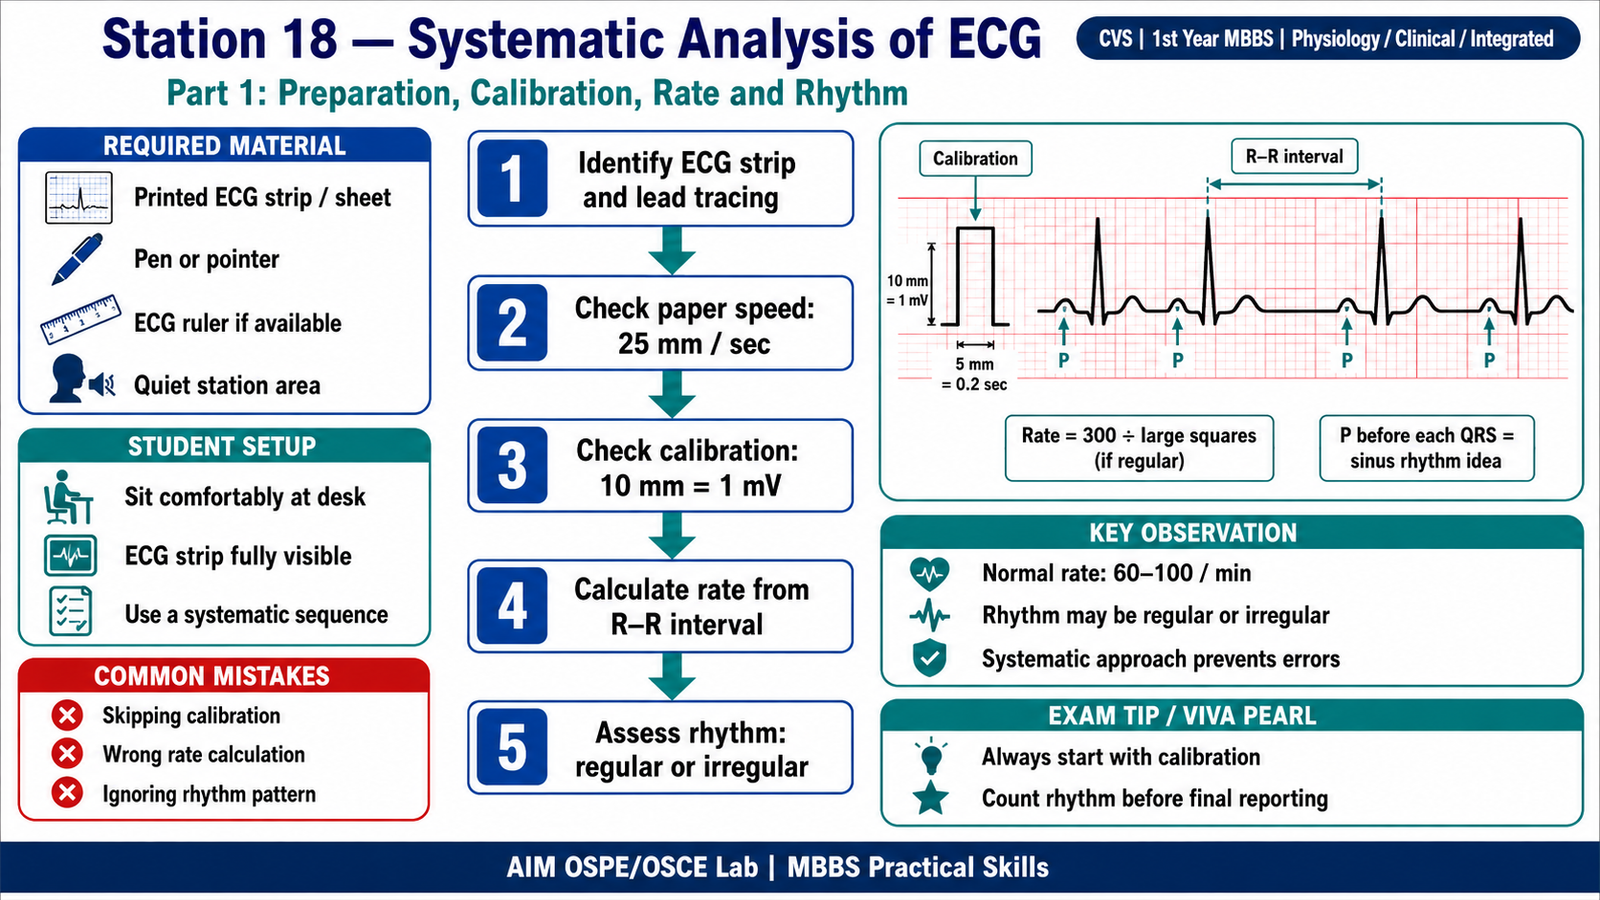
Required Material
- Printed ECG strip / ECG sheet
- Pointer or pen
- ECG ruler if available
- Stopwatch / watch if needed
- Quiet OSPE station area
Student Task / Procedure
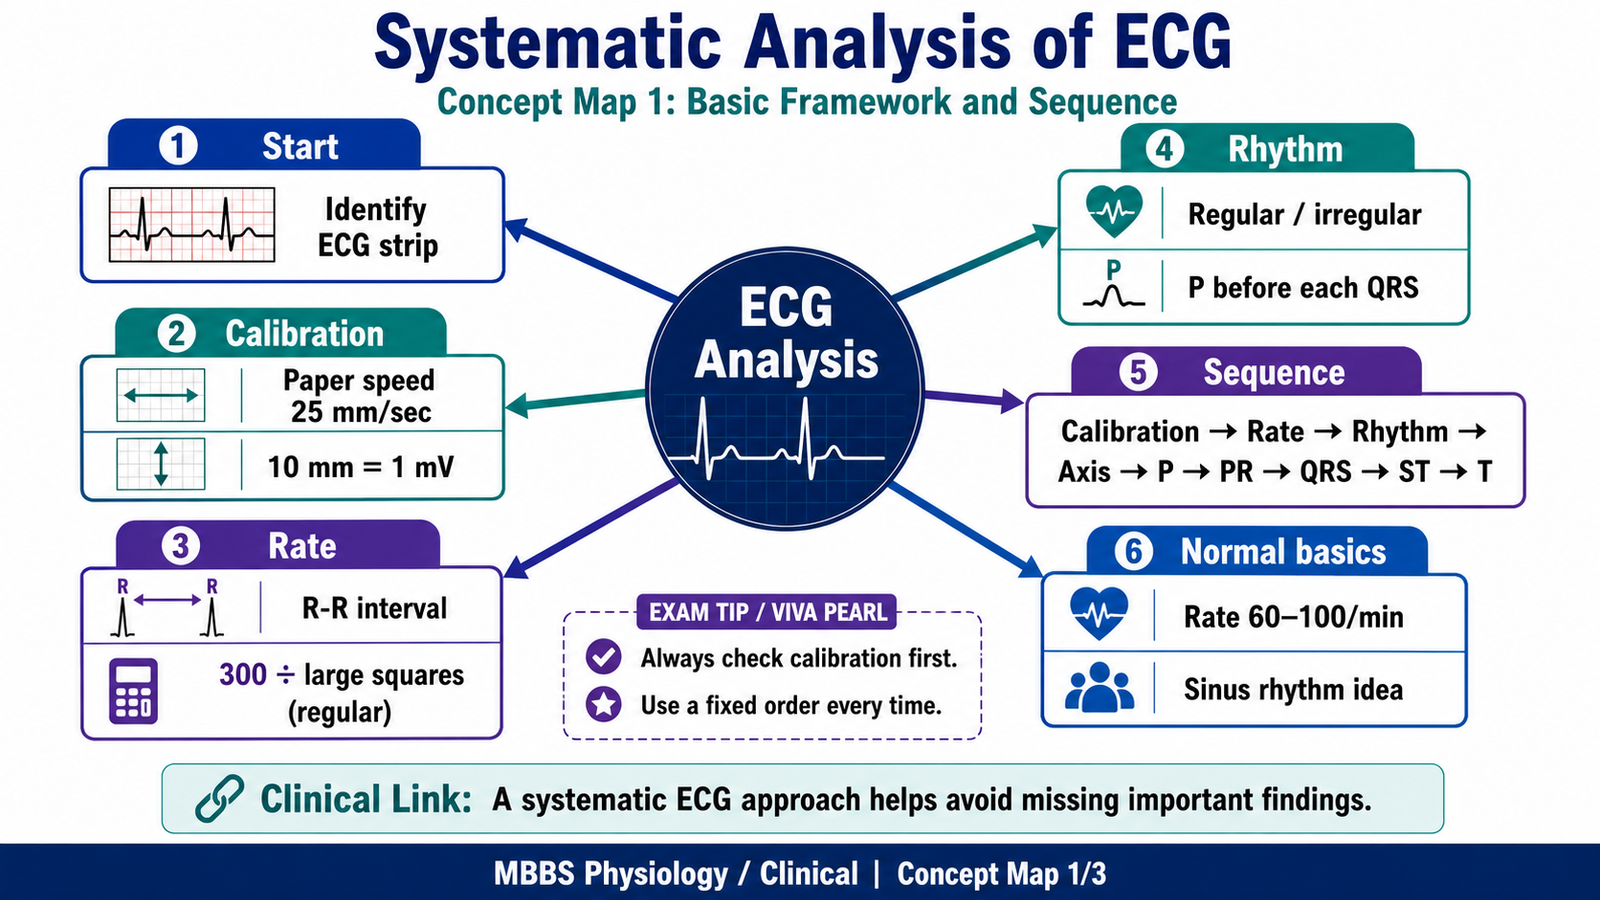
- Identify the ECG paper calibration.
- Check standard ECG setting:
- Paper speed: 25 mm/sec
- Voltage calibration: 10 mm = 1 mV
- Calculate heart rate using R–R interval.
- Assess rhythm:
- Regular or irregular
- P wave before each QRS
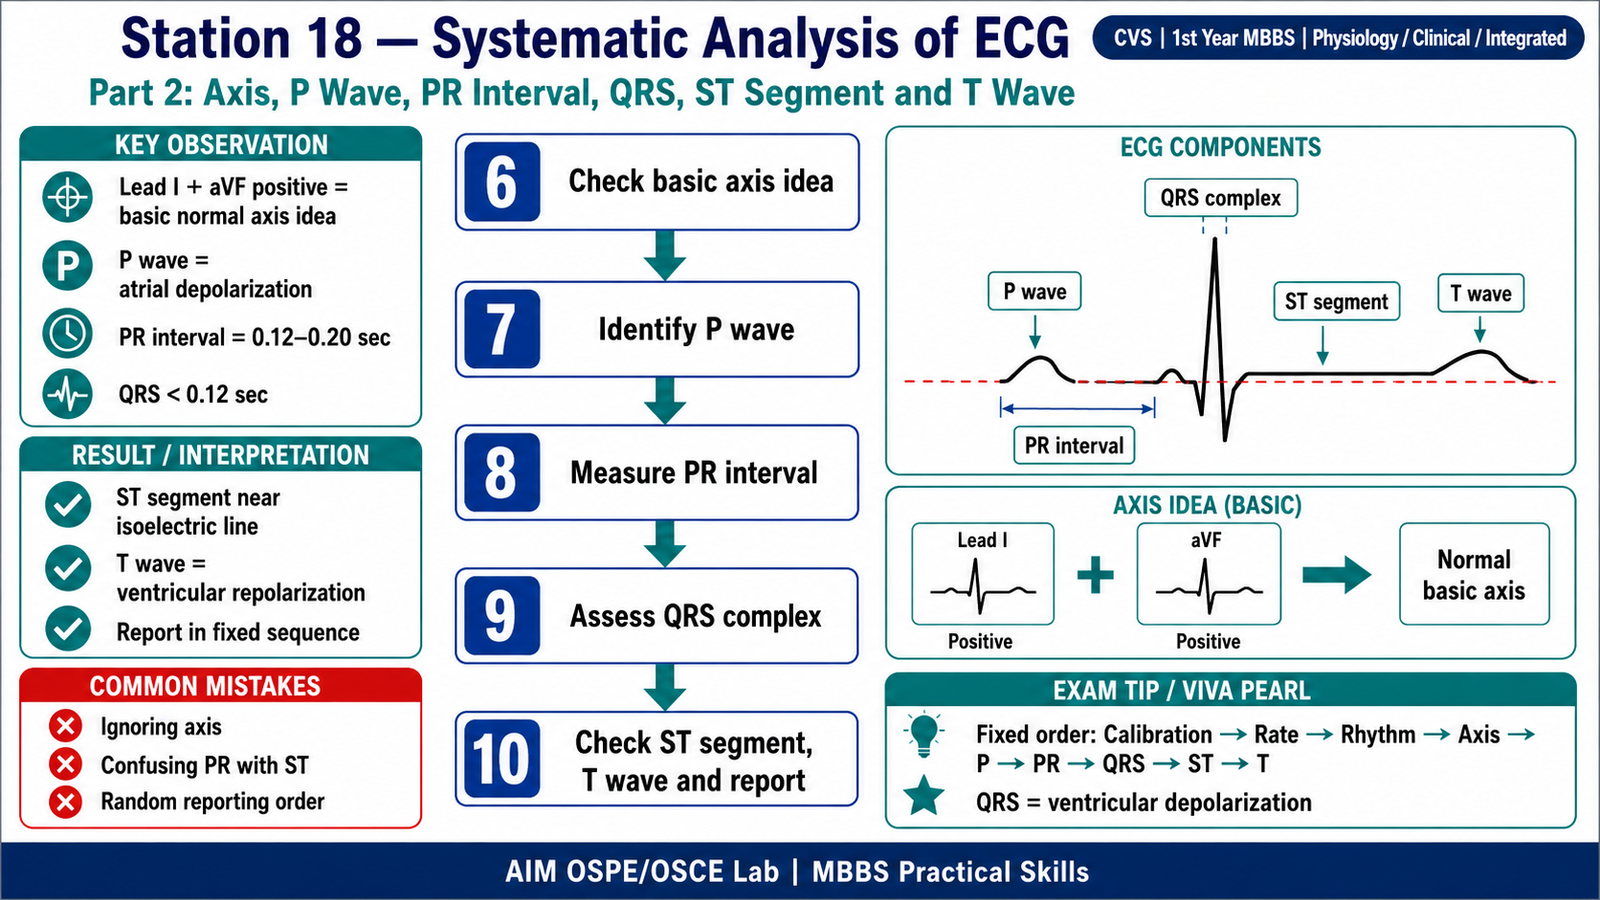
- Identify the P wave.
- Measure the PR interval.
- Identify the QRS complex and assess width.
- Check the ST segment position.
- Identify the T wave.
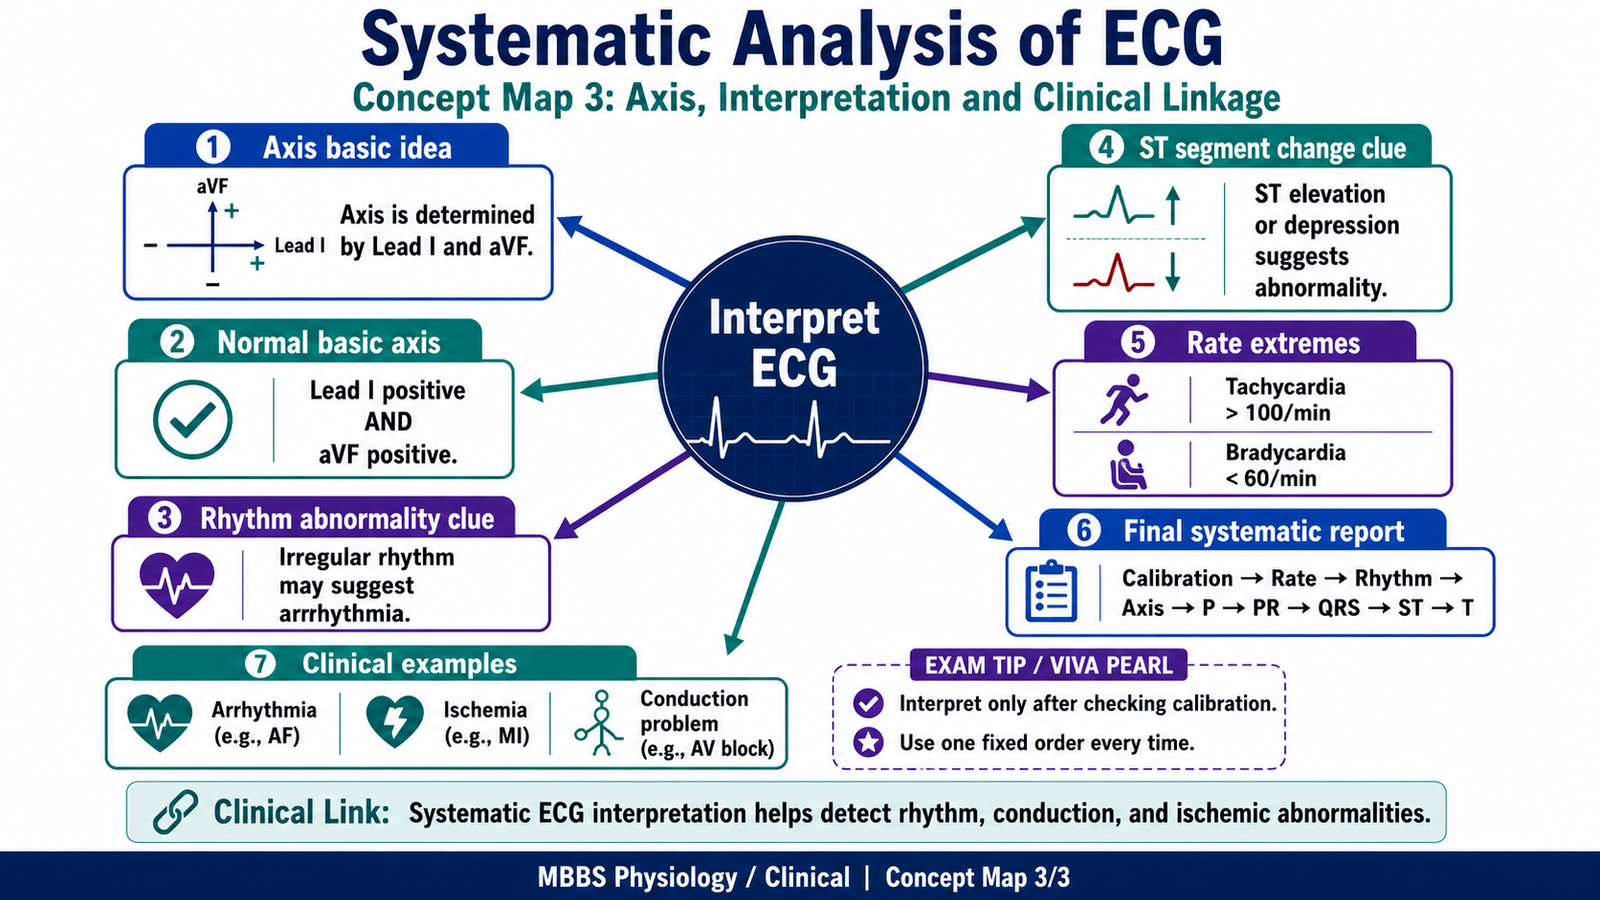
- Give a basic idea of cardiac axis using Lead I and aVF if required.
- Report the ECG findings in a systematic sequence.
Observation / Identification Points
The student should demonstrate:
- Correct recognition of ECG calibration
- Correct sequence of ECG analysis
- Assessment of:
- Rate
- Rhythm
- Axis basic idea
- P wave
- PR interval
- QRS complex
- ST segment
- T wave
- Ability to report findings clearly and briefly
- Understanding that ECG represents electrical activity of the heart
Result / Interpretation
A normal basic ECG usually shows:
- Calibration: 25 mm/sec and 10 mm/mV
- Rate: 60–100 beats/minute
- Rhythm: Regular sinus rhythm
- P wave: Present before each QRS complex
- PR interval: 0.12–0.20 seconds
- QRS complex: Narrow, usually less than 0.12 seconds
- ST segment: Normally near the isoelectric line
- T wave: Represents ventricular repolarization
- Axis: Basic normal axis idea: Lead I and aVF generally positive
Clinical significance:
Systematic ECG analysis helps avoid missing important findings. Even at 1st year MBBS level, students should recognize normal ECG waves, intervals, calibration, rhythm, and basic rate calculation.
Viva Questions
Q1. What does the P wave represent?
A: Atrial depolarization.
Q2. What does the QRS complex represent?
A: Ventricular depolarization.
Q3. What does the T wave represent?
A: Ventricular repolarization.
Q4. What is the normal PR interval?
A: 0.12–0.20 seconds.
Q5. What is standard ECG calibration?
A: Paper speed 25 mm/sec and voltage 10 mm/mV.
Marking Scheme
Total Marks: 5
| Component | Marks |
|---|---|
| Correct identification / performance | 2 |
| Key observation / procedure steps | 1 |
| Interpretation / principle | 1 |
| Viva answer | 1 |
Common Student Mistakes
- Starting ECG interpretation without checking calibration
- Looking only at rate and ignoring rhythm or waves
- Confusing QRS complex with T wave
- Forgetting that ECG should be analyzed in a fixed sequence
AIM Feedback
ECG interpretation becomes easy when students follow a fixed order every time. First check calibration, then assess rate and rhythm, then identify P wave, PR interval, QRS complex, ST segment, and T wave. Do not jump directly to diagnosis. In OSPE, marks are gained by showing a clear systematic approach.
🖼️ Visual / Image Support
🧩 Concept Map / Interpretation Support